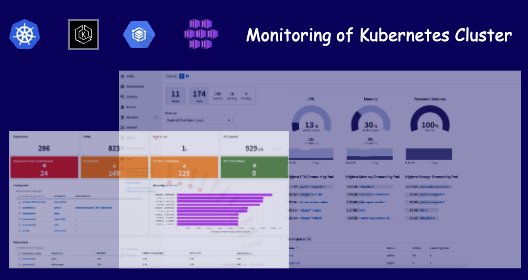
… with NetApp Cloud Insights
Monitoring Kubernetes Clusters. A must in the service world. Anyone who provides service platforms must be able to tell at any time which and how many resources the customer’s applications are consuming. Immediately everyone thinks of Prometheus or maybe Splunk. But the most common tool is Prometheus. Prometheus collects performance data of pods and services from the Kubernetes cluster and then displays it via Grafana. So why use a new or different tool?
NetApp Cloud Insight not only does performance monitoring but much more? It supports
- troubleshooting
- chargeback
- Custom specific dashboards
Especially in troubleshooting, the end-to-end play an important role. This is exactly where Cloud Insights has its strengths.
Enable Cloud Insights
However, the following post only shows how to add your Kubernetes clusters to Cloud Insights and add basic monitoring. The previous posts have already shown how to set up a Kubernetes cluster on Azure or GCP.
But if you want to know more about troubleshooting, you can contact me or one of the specialists.
If you already have an instance / or the newly created one available, you get the link displayed and can now login there.
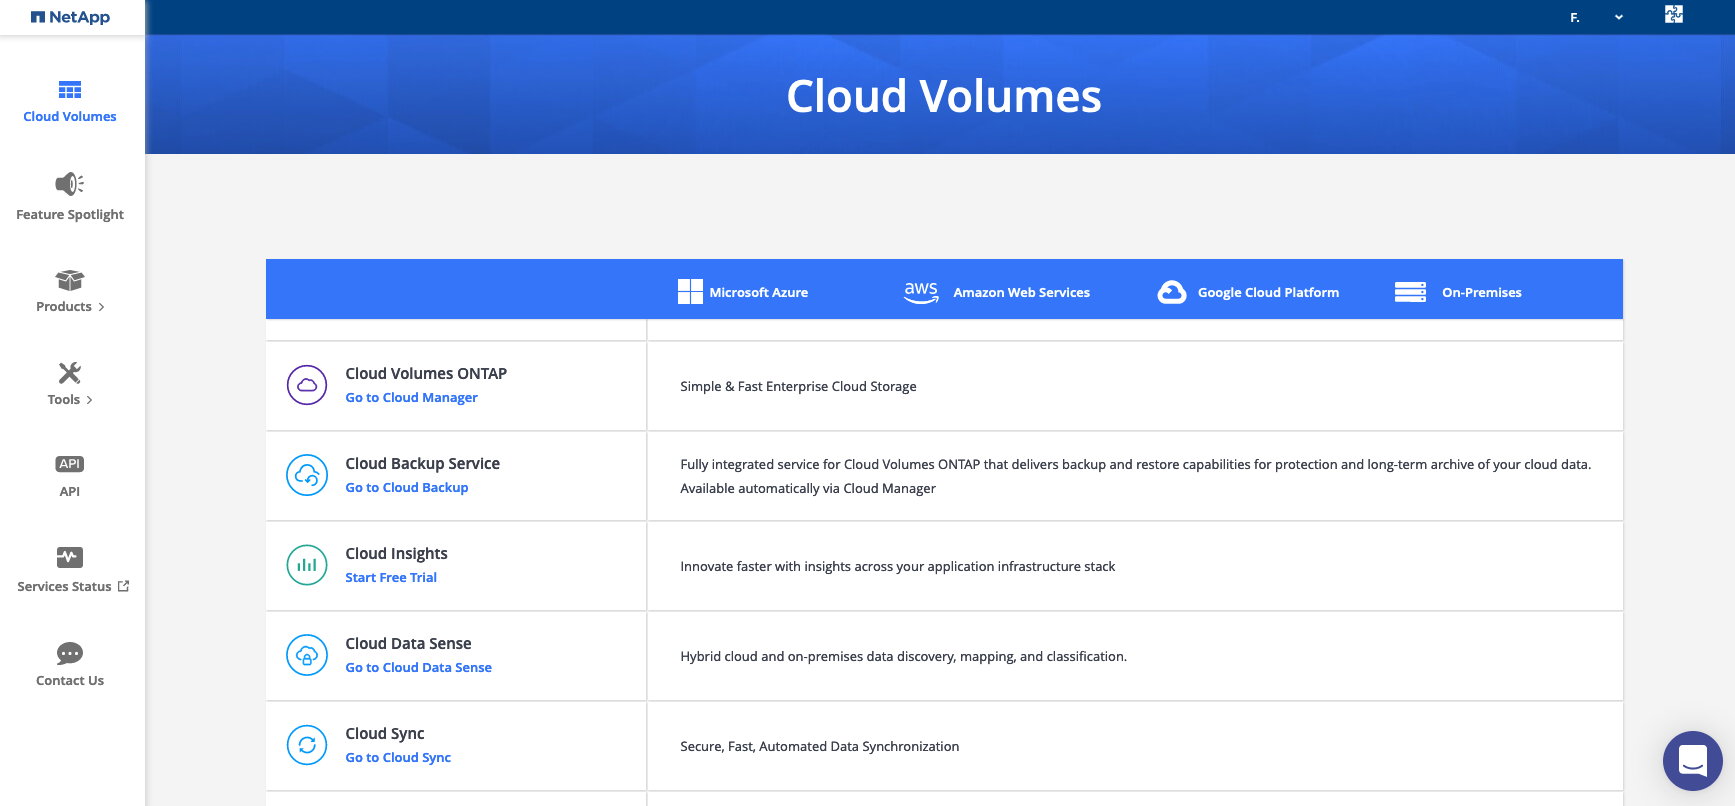
The central entry point for Cloud Insights is Cloud Central. If you are not registered yet, you should do so and have the possibility to try out many products via a trial.
After registration you can start your own Cloud Insights instance via “Products” – “Cloud Insights” – “Start Free Trial”.

Generate API token
Because Cloud Insights is a NetApp service, the performance data is sent to. To do this, a piece of software must be installed in the Kubernetes cluster, but before this can be done, the following requirements must first be met.
- Kubernetes Cluster needs access to Cloud Insights infrastructure (Internet Access). A list of addresses can be found here.
- an API token is needed for the Data Collector: How to create an API token is now the next step:
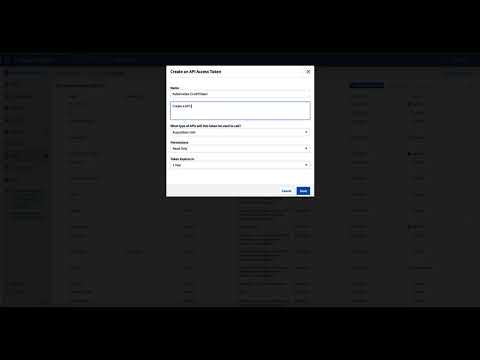
In the menu “ADMIN” – “API Access” – ”+ API Access Token”.
After saving, you get your token, which you should store safely
eyJraWQiOiI5OTk5IiwidHlwIjoiSldUIiwiYWxnIjoiSFMzODQifQ.eyJjcmVhdG9yTG9naW4iOiJzYW1scHxOZXRBcHBTQU1MfGZhYmlhbmIiLCJkaXNwbGF5TmFtZSI6ImZhYmlhbmItS3ViZXJuZXRlcy1DSS1BUElUb2tlbiAob24gYmVoYWxmIG9mIEZhYmlhbiBCb3JuKSIsInJvbGVzIjpbXSwiaXNzIjoib2NpIiwibmFtZSI6ImZhYmlhbmItS3ViZXJuZXRlcy1DSS1BUElUb2tlbiIsImFwaSI6InRydWUiLCJleHAiOjE2ODEyODk1NzksImxvZ2luIjoiOTE1YjEyY2EtZTYwMy00MGJhLWJlMzktMjI1YzA5NmI5ZWI5IiwiaWF0IjoxNjQ5NzUzNTc5LCJ0ZW5hbnQiOiI4ZDQxOTVhNi1lYmI4LTRhZDAtYTZlZi00MTMwMjM0MGI1YWYifQ.1HZ7C6OL9ViBqodCss8bYOv9P0pgvYWtFg1LubZGCf3YZ6bICBGxJn3NfVPWfd6s
Install Data Collector to Kubernetes cluster
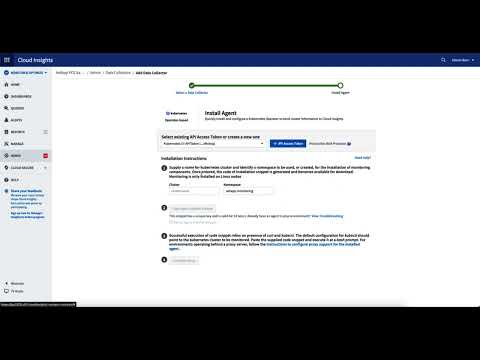
Now that the API token has been generated, we deal with the preparation or installation of the data collector. The list of all available data collectors can be found under “ADMIN” – “Data Collectors” – “+ Data Collector”. Either scroll through the list to the desired data collector or enter it into the search mask and select the operator-based collector for Kubernetes. Now you get a wizard that guides you through the installation of the data collector.
If you have successfully installed the Data Collector, you should see similar output:
  % Total    % Received % Xferd  Average Speed   Time    Time     Time  Curren
                                 Dload  Upload   Total   Spent    Left  Speed
  0     0    0     0    0     0      0      0 --:--:--  0:01:33 --:--:--     0
  0     0    0     0    0     0      0      0 --:--:--  0:01:34 --:--:--     0
100 17344  100 17344    0     0    174      0  0:01:39  0:01:39 --:--:--  4280
namespace/netapp-monitoring created
secret/monitoring-operator-secret created
serviceaccount/monitoring-operator created
customresourcedefinition.apiextensions.k8s.io/agents.monitoring.netapp.com created
role.rbac.authorization.k8s.io/agent-leader-election-role created
clusterrole.rbac.authorization.k8s.io/agent-manager-role created
clusterrole.rbac.authorization.k8s.io/agent-proxy-role created
clusterrole.rbac.authorization.k8s.io/agent-metrics-reader created
rolebinding.rbac.authorization.k8s.io/agent-leader-election-rolebinding created
clusterrolebinding.rbac.authorization.k8s.io/agent-manager-rolebinding created
clusterrolebinding.rbac.authorization.k8s.io/agent-proxy-rolebinding created
clusterrolebinding.rbac.authorization.k8s.io/agent-cluster-admin-rolebinding created
service/agent-controller-manager-metrics-service created
deployment.apps/monitoring-operator created
secret/docker created
Getting operator based installer config...
  % Total    % Received % Xferd  Average Speed   Time    Time     Time  Current
                                 Dload  Upload   Total   Spent    Left  Speed
100  3691  100  3691    0     0     35      0  0:01:45  0:01:45 --:--:--  1021
agent.monitoring.netapp.com/agent-monitoring-netapp created
The result is now, that you can see all resources of your Kubernetes Cluster in Cloud Insights.
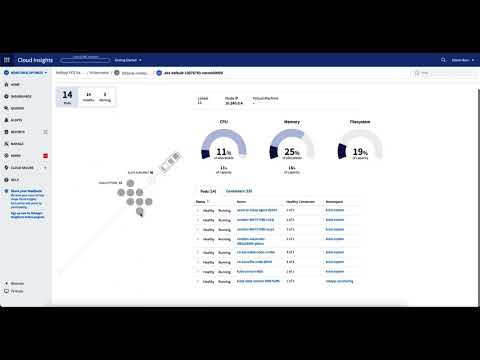
My conclusion: It is super easy to add your cluster to the monitoring with the Data Collector for Kubernetes. An important advantage is that you do not have to operate the infrastructure for the tool yourself, but use it as a service! Normally, I’m a big fan of automation and standardization of the individual steps. Unfortunately, this is currently not possible. So you have to do it step by step ;-)
